Hyperliquid Slides for Three Straight Weeks, Will It Break the $26.85 Support Level?
Hyperliquid Slides for Three Straight Weeks, Will It Break the $26.85 Support Level?
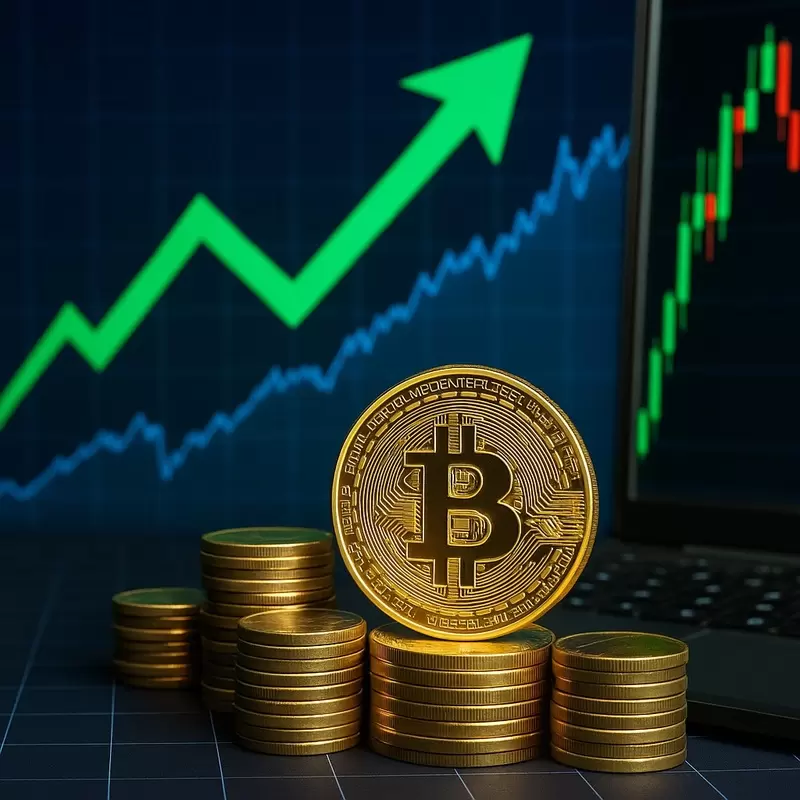
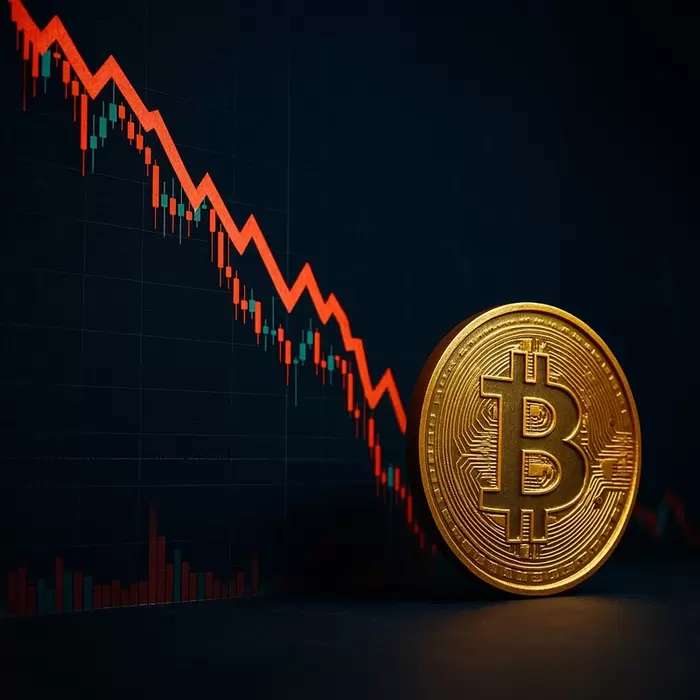
Hyperliquid (HYPE) has been unable to escape a three-week losing streak, weighed down by overtly bearish indicators in the derivatives market and mounting macroeconomic uncertainty. With sellers firmly in control and technical indicators warning of further price adjustments, investor anxiety is intensifying.
According to investment-focused outlet FXLeaders on February 23 (local time), Hyperliquid fell nearly 5% intraday, slipping below the $28 mark. Amid the prolonged bearish trend that began earlier this month, open interest has steadily declined while short positions have surged to their highest level in a month, clearly reflecting the market’s prevailing downside bias.
Detailed indicators in the derivatives market underscore investors’ pessimism. Open interest in Hyperliquid futures on Binance has been in consistent decline since late January, shrinking to $146.15 million. CoinGlass data also shows that the long-to-short ratio has dropped to 0.76, its lowest level in a month. A ratio below 1 indicates that a significantly larger number of traders are betting on further price declines.
Adding to the pressure, the open interest-weighted funding rate has fallen to -0.032%, reinforcing selling momentum. This suggests that short positions are paying long positions, a level similar to mid-October when Hyperliquid experienced a steep and sustained plunge. Compounding the situation, U.S. President Donald Trump announced an immediate increase in global tariffs from 10% to 15% in response to the Supreme Court blocking a trade agenda, triggering a sharp drop in Bitcoin below $65,000 and severely dampening investor sentiment across risk assets.
Technical indicators on the chart also point to a precarious situation. After facing strong resistance at the 100-day exponential moving average of $30.55 last Saturday, Hyperliquid has continued to trend downward amid ongoing corrections. If it fails to hold the weekly support level of $26.85 on a daily closing basis, there is a high risk of a sharp decline toward the next support level at $23.91.
On the daily chart, the 14-day Relative Strength Index stands at 43, below the neutral level of 50, and is trending downward toward oversold territory, suggesting that bearish momentum is gaining traction. The Moving Average Convergence Divergence indicator has also maintained the bearish crossover that occurred on February 10, reinforcing the negative market outlook. However, if the price stages a dramatic rebound from the $23.91 support level, there remains a possibility of another attempt to reclaim $30.55.
Disclaimer: This article is provided for investment reference purposes only and the publisher is not responsible for any investment losses incurred based on it. The content should be interpreted solely for informational purposes.  <저작권자 ⓒ 코인리더스 무단전재 및 재배포 금지>
|


  많이 본 기사
English 많이 본 기사
|