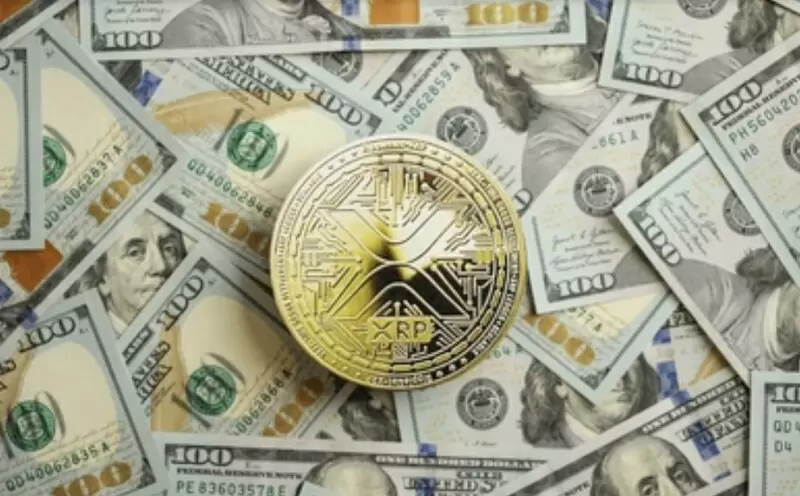
Is the crash an opportunity? XRP bottoms out as a fivefold rally scenario emerges
Is the crash an opportunity? XRP bottoms out as a fivefold rally scenario emerges
An optimistic outlook has emerged suggesting that if XRP (XRP, Ripple) breaks through a specific resistance zone, it could climb as high as $7 through a long-term trend reversal. As XRP seeks a rebound after a recent market crash that briefly pushed it below the $1 level, experts are drawing investor attention by outlining the essential prerequisites for a structural upswing.
According to cryptocurrency-focused outlet Finbold on February 10 (local time), crypto market analyst DavidtheBuilder said in a CoinMarketCap analysis that the $2.70 to $3.00 range will be a critical inflection point determining XRP’s future direction. He noted that a decisive breakout and stabilization above this range could shift the market’s structural momentum, triggering strong technical buying and significant inflows of sidelined capital.
If this bullish scenario materializes, the analyst expects XRP to rise quickly to an initial target of $5, and if favorable market conditions persist, $7 could become a realistic objective. XRP is currently trading around $1.43, moving in tandem with broader market sentiment. While it has seen a modest rebound over the past 24 hours, it remains down more than 11% on a weekly basis.
However, caution was also raised that a simple technical breakout alone may be insufficient to sustain a long-term rally. The analyst emphasized that for short-term momentum to convert into sustainable demand, fundamental support is essential, including tangible expansion in cross-border payments adoption, increased participation by institutional investors through exchange-traded funds (ETFs), and a revival in on-chain transaction volumes.
At present, XRP’s technical backdrop remains predominantly bearish. Within a long-term downtrend that began toward the end of 2025, a pattern of lower highs and lower lows has persisted. The price is trading below both the 50-day moving average at $1.89 and the 200-day moving average at $2.40, indicating a downward medium- to long-term trend.
Meanwhile, the 14-day Relative Strength Index (RSI), a momentum indicator, stands at 37.8 and remains in neutral territory. This suggests that selling pressure has eased somewhat, but the reading is still insufficient to confirm a strong trend reversal.
*Disclaimer: This article is provided for investment reference only, and no responsibility is taken for any investment losses based on it. The information should be interpreted solely for informational purposes.*
<저작권자 ⓒ 코인리더스 무단전재 및 재배포 금지>
|


  많이 본 기사
English 많이 본 기사
|